This post describes how I wrote a python based tool to allow me to obtain reliable stock fundamental data and ratios in an automated way. I outline a few approaches I tried and then briefly describe the tool quandl_fund_xlsx and it’s use. The linked github page contains a README with instructions for installing and using the tool, I’ll not be covering that here but providing a bit of a back-story regarding the rationale for creating the tool.
The Problem and Requirements
I like to invest in individual stocks as well as index funds. As a long term investor, I’m interested in the fundamentals of a business to give me a sense of profitability, growth, indebtedness etc.
I’d also like obtaining this information to be automatable so that I easily obtain the data for a set or portfolio of stocks without having to manually go to some website, click, download, import into excel, massage to find ratios etc..
In addition to the fundamental data from the Balance Sheet, Income Statement and Statement of cash flows, I wanted lot’s of financial ratios. Ideally I’d be able to customize which ratios are calculated.
Finally I wanted the output data to be in the form of an excel spreadsheet so that I can easily further process, it visualize it and make comparisons between individual equities.
Attempts at a Solution
Web Scraping
I tried to web-scrape the Morningstar site using the Python Beautiful Soup library; unfortunately the Morningstar pages are delivered as a bunch of JavaScript to the browser so there’s nothing to scrape.
I could have scraped yahoo finance or google finance, but the more I looked the more I saw that things change on these pages or the page goes away and that scraping in general was going to be fragile and at the mercy of the page provider.
Using the raw XBRL data from Edgar
After having read about the XBRL data format for corporate financial filing, I created a command line interface (CLI) python package sec_edgar_download to download filings from the SEC Edgar site in XBRL format. Once I had my raw XBRL filing data I set about writing an XBRL parser to extract the data. Long story short, parsing XBRL is a rabbit hole of complexity [Charlie Hoffman’s Blog] (https://bit.ly/2S5nw1S), with different companies reporting in subtly different, yet XBRL “legal” ways making for a too large a project than I wanted to bite off. Consider just one of the items reported, that of revenue [Finding Revenues in SEC XBRL Financial Filings] (https://bit.ly/2AXVyv8).
I now wondered if there were any free or inexpensive reliable sources of already parsed corporate filing data with a nice API to access it. After some more research and experimentation I discovered Quandl and more specifically the Sharadar Fundamentals database.
The solution: Quandl and Sharadar
Quandl provide access to a large number of financial, economic and alternative datasets, via a number of different access methods, WEB, Python, R, Ruby, Excel.
One of the datasets they offer access to is The Sharadar fundamentals dataset. This provides both free and paid versions of data for 14,000 US companies with 20 years of history and 150 so called indicators for each company in each reporting time period. They provide data from the Income statement, the cash flow statement and the balance sheets. This data is available quarterly, annually and trailing 12 months. In addition to the company provided data, Sharadar calculates a number of financial ratios. As I read more on investing I’ll find yet another ratio that maybe indicative of a companies health ( there’s no one magic indicator), so my needs go beyond the ratios which are provided and I calculate many additional ratios.
The python API allows for the data to be provided in a python data structure called a pandas dataframe. Think of pandas as matrices on steroids. The pandas package allows for very simple manipulation of arrays of data, so calculating new ratios from the source data is fairly easy.
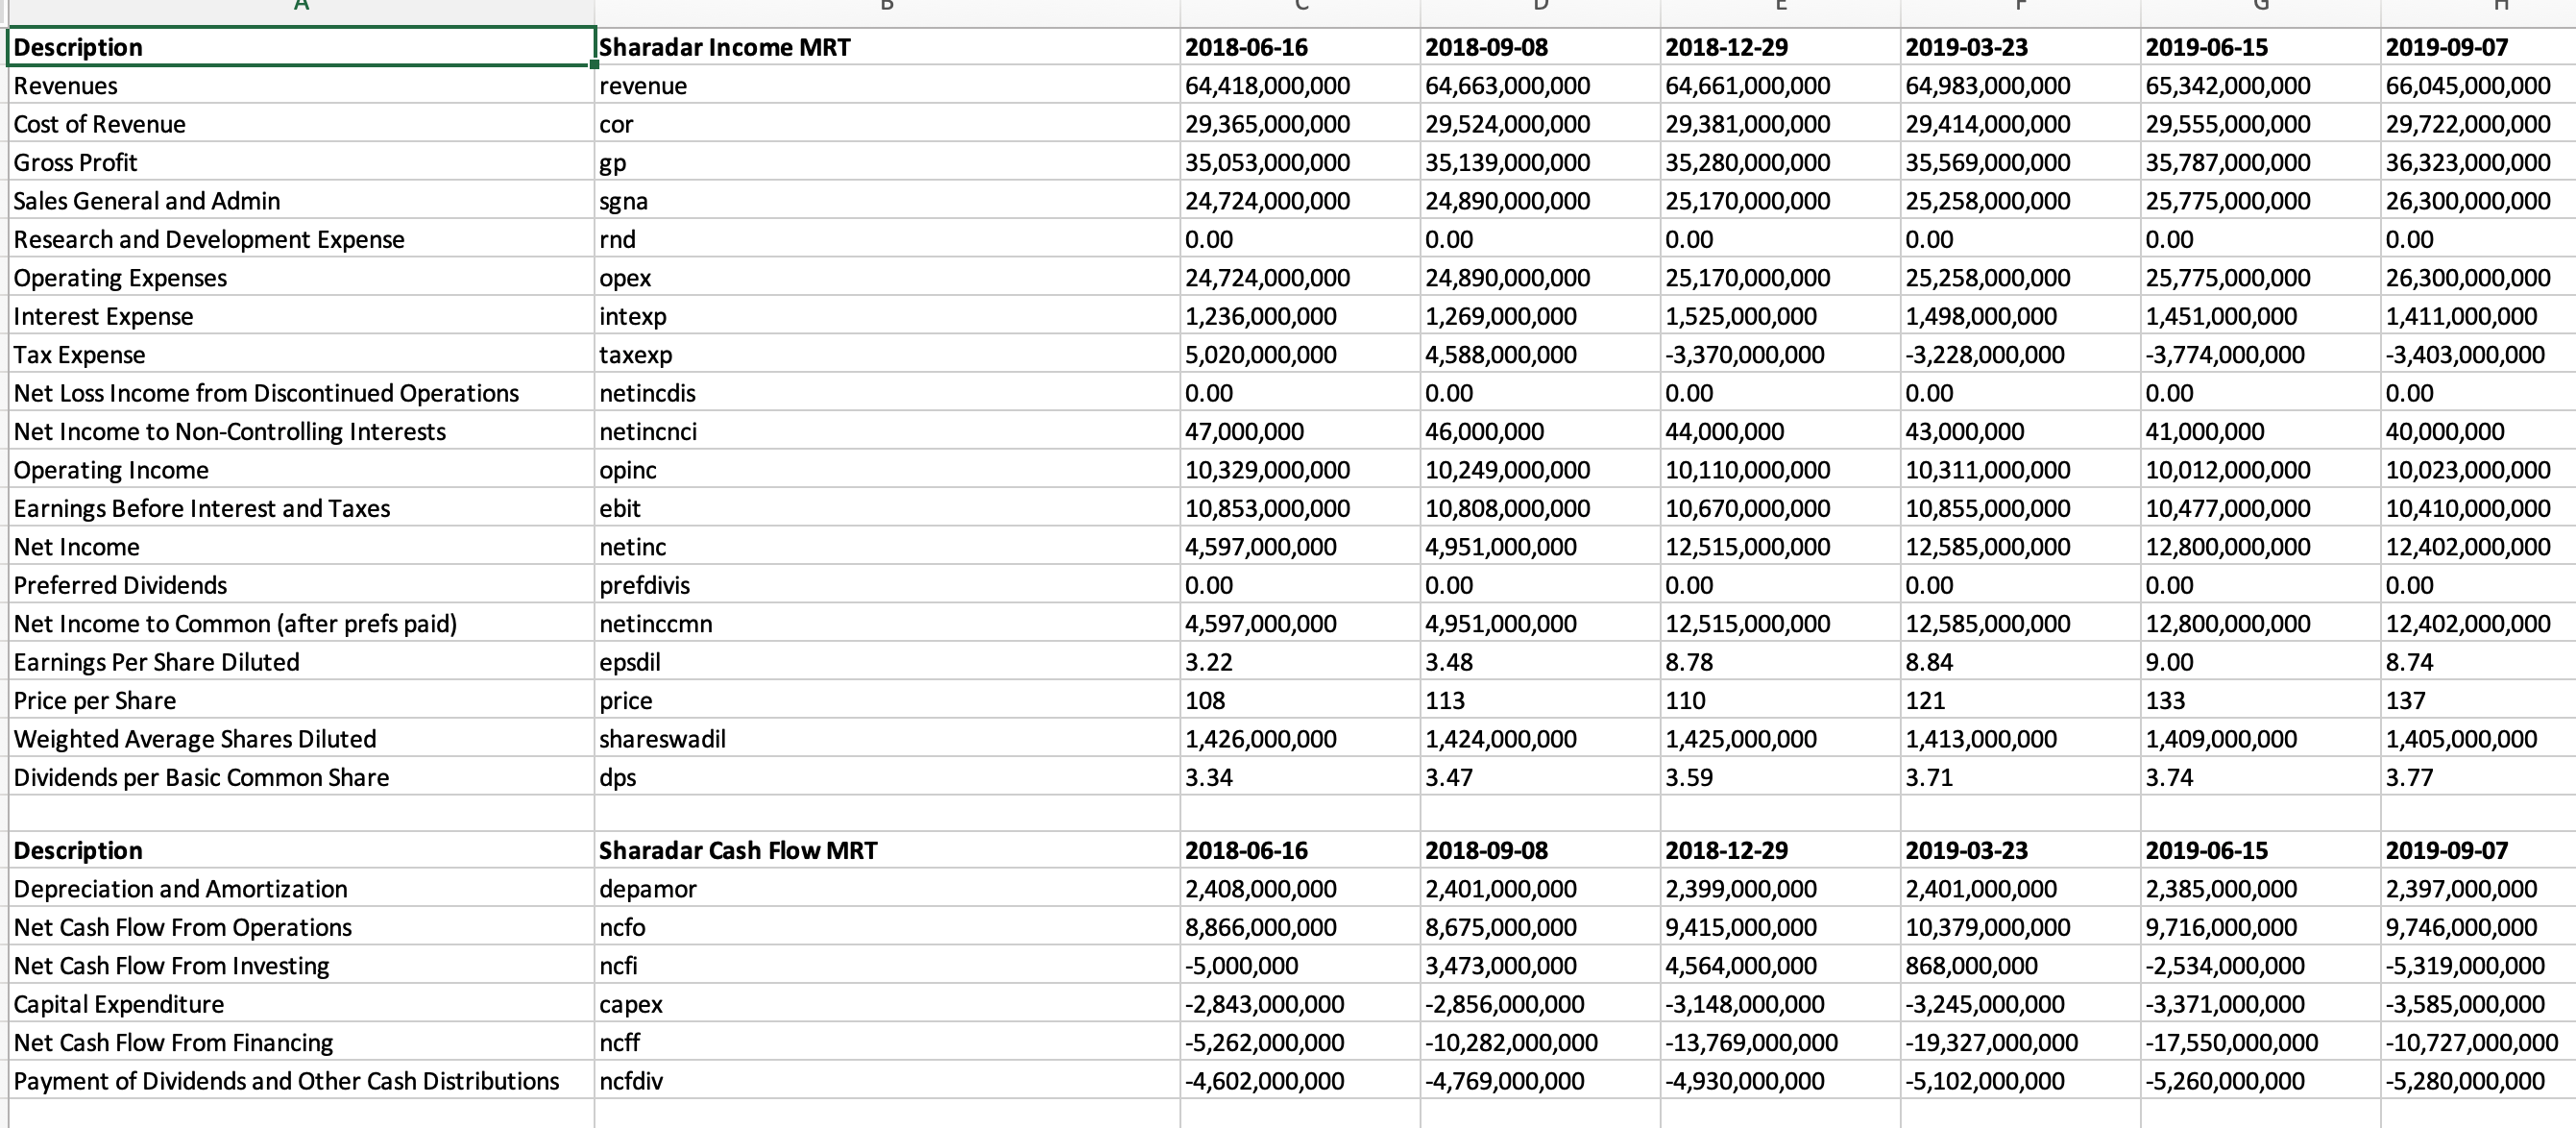
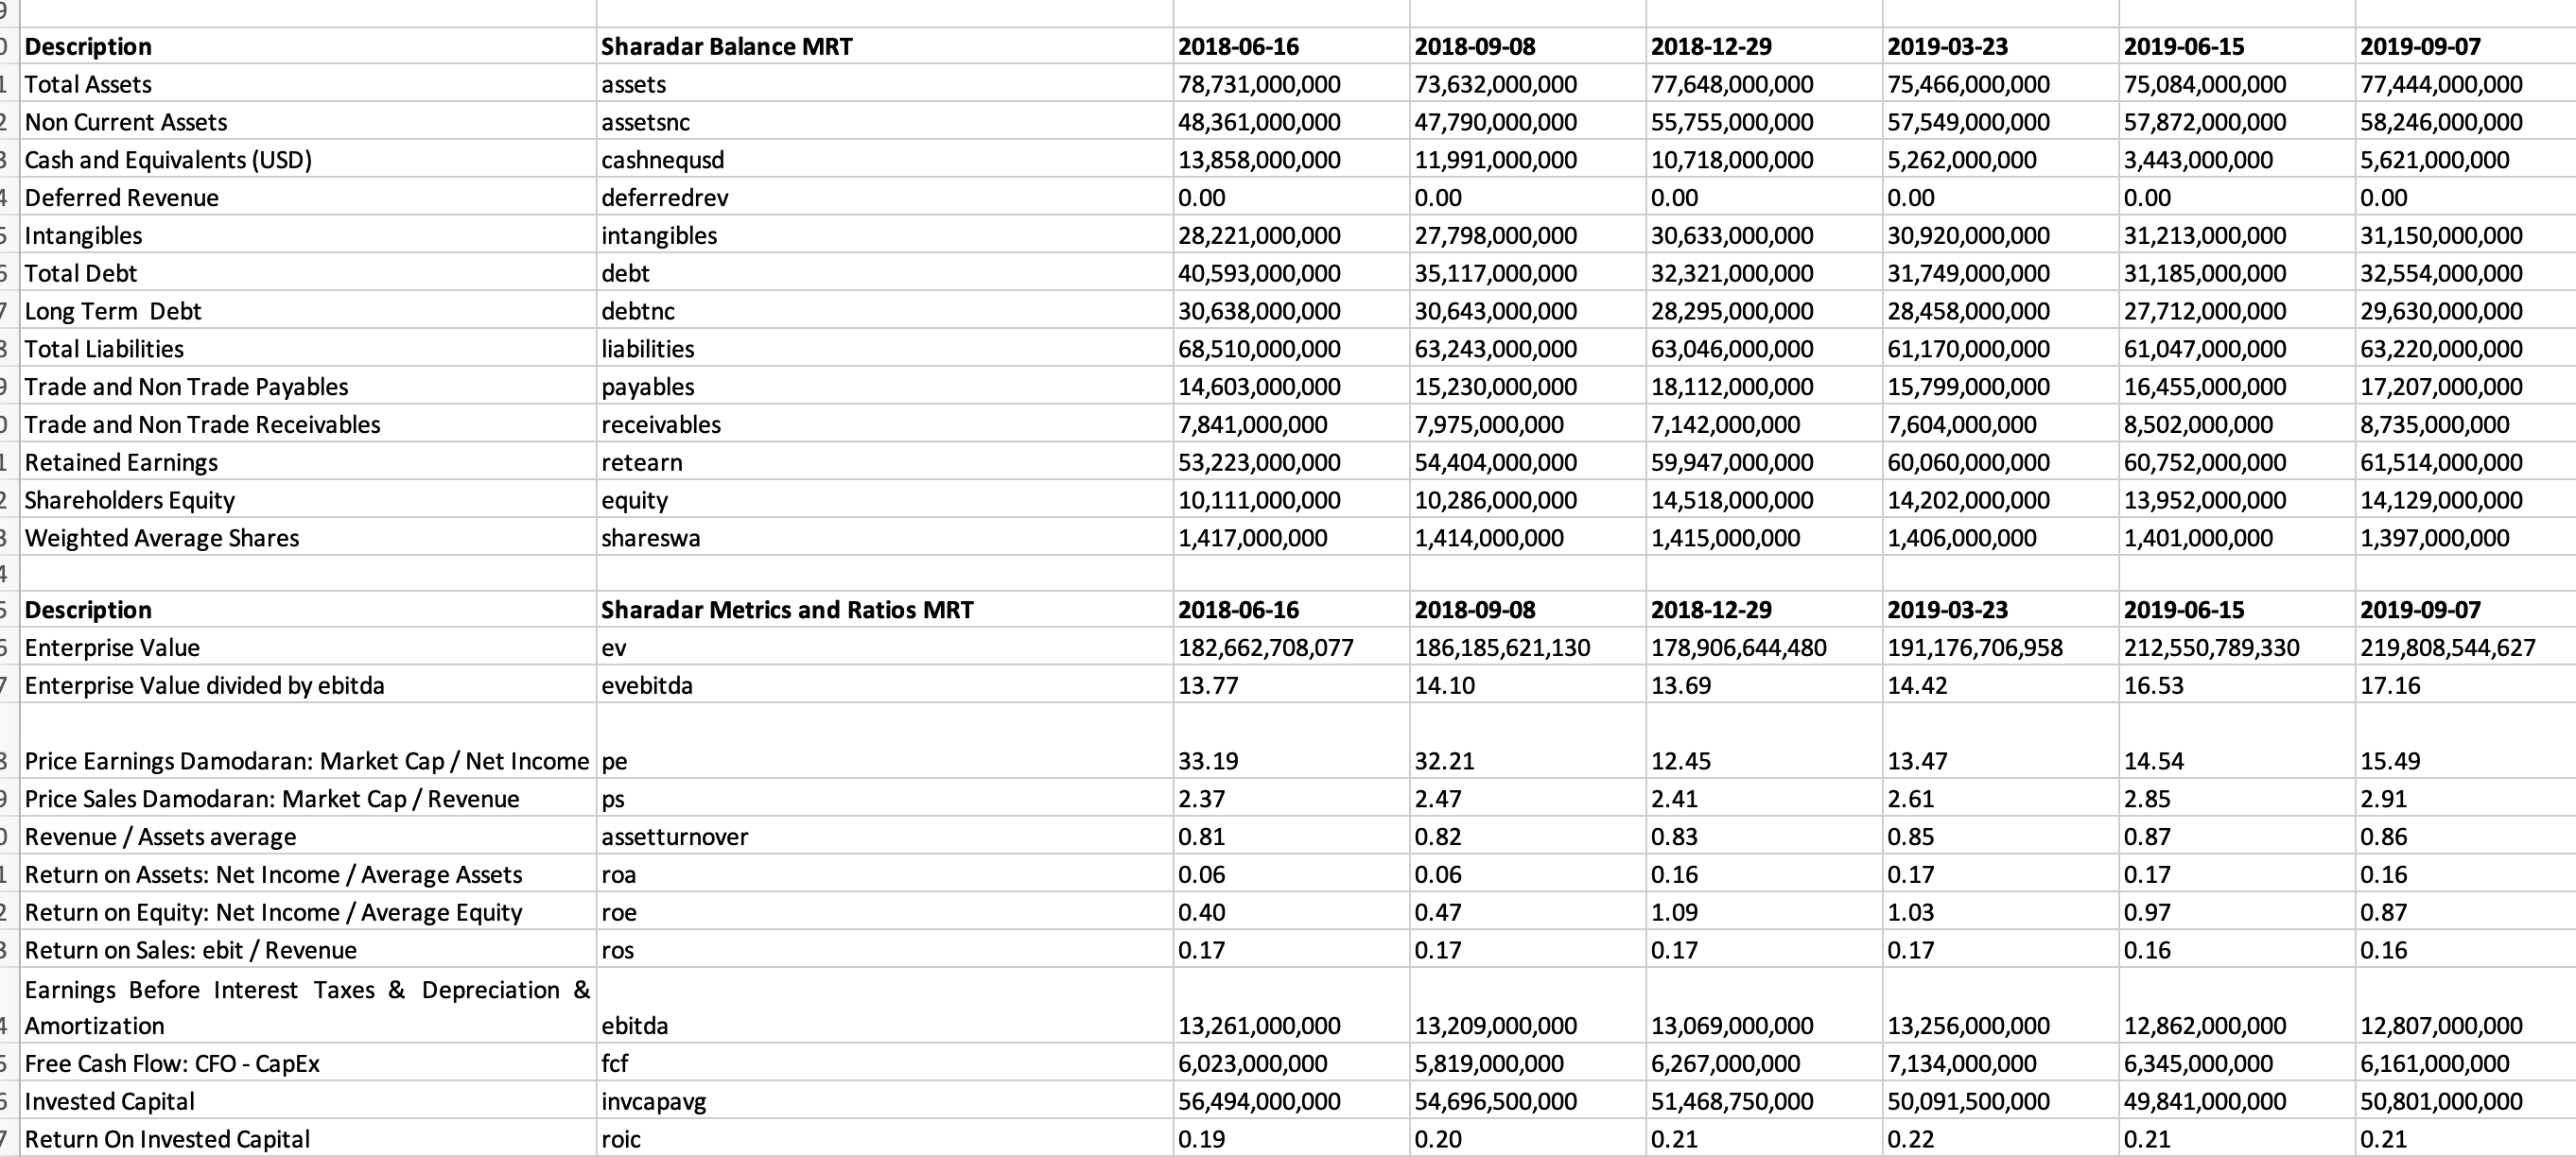
The tool I ended up creating is a python based command line tool which takes as input a list of tickers, or a ticker file, and outputs an excel workbook with a separate sheet for every ticker with datapoints given for each reporting period in a separate column. I calculate over 30 additional ratios as well as Compound Annual Growth rates for all values, as I read and learn more I’m always adding yet another metric for curiosity and interests sake.
Caveat Emptor
In addition to checking the disclaimer and the LICENSE file on the project github page it’s important to apply common sense and question the values calculated.
In certain cases some ratios might look too good to be true or excessively bad. It’s worth examining closely the SEC filing calculating the “old fashioned way” to double check these values. One simple example is that of Interest payments.
Not all companies report these on the income statement. For example, INTC, EPD and HD do, MSFT and AAPL don’t. The interest for AAPL and MSFT will be reported as zero and hence any metrics with interest in the denominator (EBIT/Interest expense) will be invalid, these will show up as “inf” on the spreadsheet. The interest payments will often be separately disclosed, for example for MSFT under the “Notes to Financial statements” in the section “Other Income (Expense) NET.
Conclusion
Having the ability to rapidly and programmatically download information for an individual ticker or a set of tickers (It’s very informative to compare companies within the same industry group) makes it more likely that you will keep up to date with a companies fundamentals and either:
- Continue to get a warm feeling about holding a stock.
- Decide that things are deteriorating and consider selling.
- In the case of the latest tip from someone opining on say Seeking Alpha be able to form your own opinion.